
By using the well-tested Gompertz function, semiconductor companies have a way to determine areas in which to focus their attention and investments.
Source: EETimes

Is there a way to predict the future of semiconductor revenue driven by new products? This was the provocative question Dr. Walden (Wally) Rhines, Chairman and CEO of Mentor Graphics, asked and answered in a recent keynote presentation at Mentor’s U2U User Group in Munich, Germany.
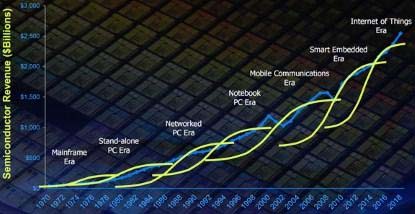
Wally started by looking at the history of the semiconductor industry and observed that, over time, its growth has been powered by applications that took off and grew enormous amounts of revenue. Examples include the calculator, the PC, and the wireless handset revolution. Each stepped up the revenue, grew, and flattened, and then a new product came along and the cycle repeated itself (see Figure 1).
Wally wondered about the next wave of products, and found that there is a way to predict product lifecycles via the Gompertz curve. This was named for Benjamin Gompertz who, in 1825, proposed a mathematical model for a time series, where growth is slowest at the start and end of a time period.
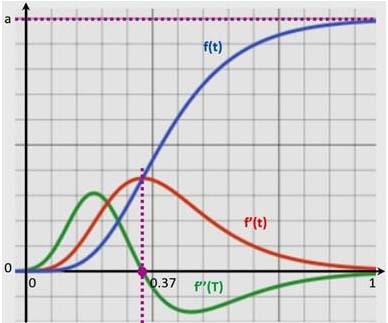
The Gompertz curve is a double exponential function shaped as an elongated “S.” The right-hand, or future value, asymptote of the function is approached much more gradually by the curve than the left-hand, or lower-valued, asymptote; this contrasts to a simple logistic function in which both asymptotes are approached by the curve symmetrically.
The function is controlled by three coefficients a (the upper asymptote),b (moves the graph to the left or right along the time taxis), and c (sets the growth rate or the scaling of f(t)):
f(t) = a*exp(-b*exp(-c*t)
The Gompertz curve is used widely to predict things that happen in time, like the growth of tumors, the growth of the population, the mobile phone uptake, and market impacts on finance. It has withstood the test of time.
For our purposes here, we want to predict the lifecycle of a new product. By determining the three coefficients early in the cycle, the remainder of the cycle can be predicted.
For any typical product or technology, the lifecycle begins by shipping a few units followed by a rapid growth of units per year. Eventually, the product matures and growth declines. Integrating that curve returns the cumulative units over time.
The S-curve finds that the cumulative units in the early stage have a high percentage of growth, but it takes forever to get started. A real-life example is a cancerous tumor in a body. This takes a long time before it reaches critical mass, after which it starts to grow rapidly, and this is followed by a period of constant growth.
At some point, the second derivative of the curve goes to zero. This occurs about 37% of the way through the product lifecycle, and corresponds to the point where the slope of the curve turns from positive to negative and the growth rate drops to zero; however, two-thirds of the market has yet to be served. At maturity, the unit growth rate is lower. Throughout this period, the number of incremental units per year is greater than the year before (see Figure 2).
Solid-state image sensors
What happens when the Gompertz curve is applied to high tech? Wally chose solid-state image sensors that began to be widely used back in 1990 when designers started to put them into cell phones. Back then, the average unit price was close to $25, but came down when — after a long period of slow growth — the unit volume took off. Today, units shipped are in the range of four billion or so (see the upper chart in Figure 3)
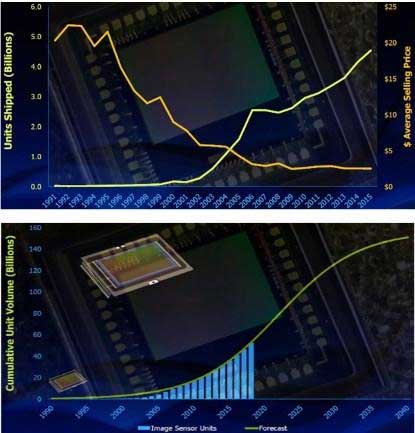
By mapping the growth of solid-state image sensors using a Gompertz plot, it’s easy to see that this market is still in a relatively growing part of its lifecycle, even though these sensors are predominantly used in cell phones. In fact, solid-state sensors haven’t hit the second derivative of being zero yet. Not only does the number of units increase every year over the previous year, but there’s also (currently) a positive growth rate (see the lower chart in Figure 3).
How can this be? After all, everyone has a cell phone. Well, the thing is that cell phones are just the beginning of the potential for solid-state image sensors. Surveillance is driving a 46% growth rate per year compounded in the number of image sensors required. Furthermore, the number of image sensors in cars is increasing rapidly. In a new home, image sensors are everywhere. Thus, we can predict that solid-state image sensors will be a healthy market for many years to come, based on the Gompertz plot.
The Internet of Things
What is most striking is using the Gompertz plot to assess emerging opportunities with investment potential. One obvious market is devices for the Internet of Things (IoT).
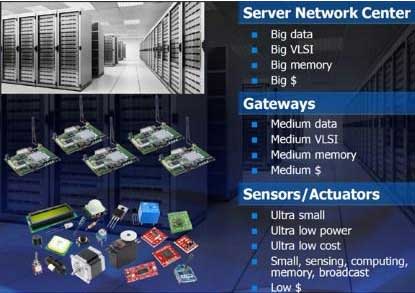
The semiconductor industry should be impacted in three major areas by IoT. First and foremost is the data center with the biggest of big digitalized ICs, data storage, and analytics and networking, pushing the technology and using 7nm and 5nm or the next technology node.
Second, gateways or data collection hubs, where data is collected, aggregated, and pre-processed. Surprisingly, gateways are growing.
Third, IoT nodes — including sensors, actuators, imagers, and transmitters — are ultra-small, ultra-low-power, ultra-inexpensive, and are the great hope of much of the semiconductor industry (see Figure 4)
Data centers
The data center offers the most promising and exciting opportunity. It’s easy to see why companies like Avago (now Broadcom) acquired the companies it did by filling in the squares in the data center and understanding what’s going to be required.
The data center is early in its lifecycle. Even though data centers have been around for years, the number of units is going to have positive growth for quite some time. This is a long-term growth market that will not hit the second derivative to zero until 2040 or so. Today, 4% of total semiconductor revenue is generated by the equipment that goes into the data center in the form of servers, networking equipment, and memory.
Big data and big chips are changing the way the semiconductor industry does design. It used to be that engineers got along with a simulator and tools that helped with the stimulus for design, measurement and analysis, and debug. It’s the big data center, processing of big data, and data analytics that drove chip design for networking, processors, and graphics into the hardware emulation world. Recently, the hardware emulation business, which was a pretty sleepy business of about $150 million a year, jumped to $350 million. The emulator moved from the laboratory and a mass of wires into becoming a server in the data center. Any engineer designing big digital network equipment, CPUs, graphics chips, or video chips has made the switch from simulation to emulation. Companies have one emulator and it’s shared remotely worldwide.
The adoption of emulation caused a major change in the way design is done. The integration with simulation matured to the point where an engineer can go back and forth between simulation and emulation or use one or the other to perform several different types of analysis, from power analysis to run test vectors for Design-For-Testability (DFT) analysis. This wasn’t possible five or six years ago.
Solid-state storage
Within the next year or two, the price per gigabyte of solid-state drives is going to be cheaper than that of hard disk drives. Of course, the industry doesn’t wait for cheaper prices. Instead, it starts converting and many personal computers already use solid memory.
The same thing will happen in server centers. This is an enormous number because an enormous amount of silicon area will be used to build out that memory. The Gompertz plot confirms the use of solid-state drives in the server center is growing rapidly, but it is early in the lifecycle with plenty of revenue to come.
It is interesting to note that in 1990, 45% of all transistors produced were memory transistors. Today, 99.7% of all transistors manufactured are memory transistors, and that’s only discreet memory. This number doesn’t include embedded memory in system-on-chip (SoC) devices.
Memory companies have excess capacity, yet they build more memory because new applications are requiring vast amount of memories. For example, to upload 400 hours of video every minute requires a daily capacity of a petabyte. By 2025, this will grow to two exabytes of video.
Gateways
Gateways are the data collection hubs gradually emerging in the hierarchy of IoT, right below the data center.
The Gompertz plot says that this it is a growth industry, although it is not going to be enormous compared to the server center and big data. It is 3% of the total semiconductor revenue and increasing as a percentage of the total.
IoT Nodes
The actual IoT nodes revenue in 2015 was $15 billion — 30% of this came from sensors and actuators, while the rest came from a combination of analog, micro-controllers, and types of meters.
Today, the largest share is used for the infrastructure. Devices are getting more complex with micro-electromechanical systems (MEMs), micro controllers, accelerometers, batteries, and RF communications creating a welcome challenge for those who design them because they are complex multi-physics system designs. They require interfaces between micro-mechanical devices and analog, digital, and RF circuits, and signal integrity simulation and system-level noise analysis. It is a challenging problem since IoT vendors are going to develop thousands of different types. In fact, there will probably be tens of thousands of companies wanting to design their own devices.
IoT nodes can take many different forms, such as smart meters. The smart meter segment is in the early stages and in the positive growth phase with only 15% to 20% of the total meters shipped. This is a good market with two-billion cumulative units.
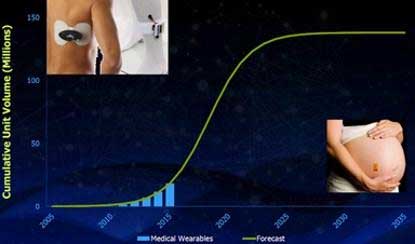
IOT wearables are also in their infancy. The cumulative unit volume over time will reach four-trillion units. So far, a small number have been shipped, making it is a good growth opportunity. A subset of this is medical wearables, which is still in the early lifecycle. This is a good market with high unit prices and enormous potential for monitoring health, though it may be constrained by regulations or qualifications from the Food and Drug Administration (see Figure 5).
In conclusion, by using the well-tested Gompertz curve, semiconductor companies have a way to determine areas in which to focus their attention and investments.
Dr. Lauro Rizzatti is a verification consultant and industry expert on hardware emulation (www.rizzatti.com). Previously, Dr. Rizzatti held positions in management, product marketing, technical marketing, and engineering. He can be reached at lauro@rizzatti.com.