
Source: Verification Horizons

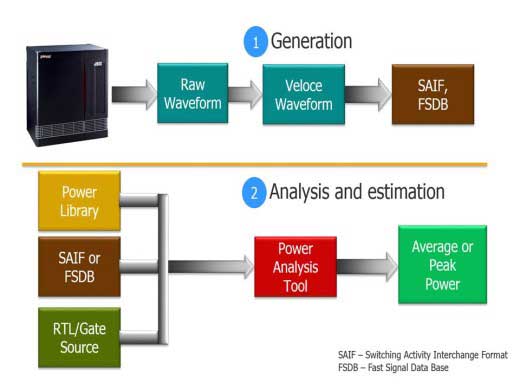
There are intrinsic limitations in the current approach for estimating dynamic power consumption. Briefly, the approach consists of a file-based flow that evolves through two steps. First, a simulator or emulator tracks the switching activity either cumulatively for the entire run in a switching activity interchange format (SAIF) file, or on a cycle-by-cycle basis for each signal in a signal database file such as FSDB or VCD. Then, a power estimation tool fed by as SAIF file calculates the average power consumption of a whole circuit, or an FSDB file computes the peak power in time and space of the design.
The method may be acceptable when the design-under-test (DUT) is relatively small, in a ball-park of a few million gates or less, and the analysis is performed within a limited time window of up to a million or so clock cycles. Such time windows are typical when the DUT is tested with adaptive functional testbenches.
When applied to modern, large SoC designs of tens of hundreds or millions of gates executing embedded software, such as booting an operating system and running application programs that require billions of cycles, three problems defeat the conventional approach:
1. The sizes of SAIF and, even more so, FSDB/VCD files become massive and unmanageable
2. The file generation process slows to a crawl that extends to hours, possibly exceeding a day
3. File loading into a power estimation tool extends to several days or more than a week
New software for the Veloce emulation platform eliminates the core problems affecting the conventional approach to estimate power consumption. It eliminates the two-step, file-based flow by tightly integrating the emulator to the power analysis tool.
In this new approach, an Activity Plot maps in one simple chart the global design switching activity over time as it is occurring, booting an OS and running live applications.
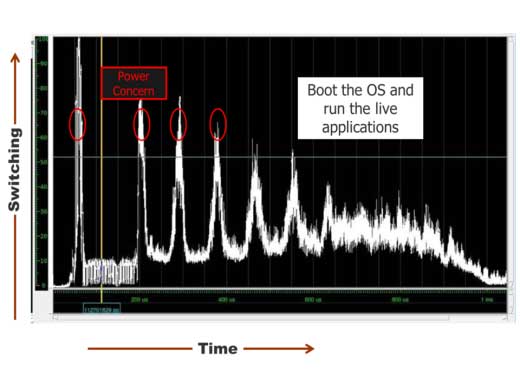
It identifies time frames of high switching activities that may pose power threats to the design team. While this chart is not unique, its creation is an order of magnitude faster than the generation time of file-based power charts. As a data-point, Veloce takes 15 minutes to generate an Activity Plot of a 100-million gate design for 75-million design clock cycles. Power analysis tools could consume more than a week to generate similar information. Moreover, they may not be able to handle such a large volume of data.
Of course, the next questions are, “where” are those peaks happening in the DUT and “what” is causing them? This is addressed by replacing the file based approach with a Dynamic Read Waveform API for the signal data.
Dynamic Read Waveform API Flow
Once high-switching activity time frames are identified at the top level of the design, the design team can zoom into those frames. Users can dig deep into the hierarchy of the design and the embedded software to uncover the main source of such high-switching activity.
The Dynamic Read Waveform API replaces the cumbersome SAIF/FSDB/VCD file generation process by live streaming switching data from the emulator into the power analysis tool. All operations run concurrently, from emulating the SoC, design capturing switching data, reading switching data by the power analysis tool and generating power numbers. The net effect is a jump in overall performance from booting an OS and running real applications.
As a side benefit, the Dynamic Read Waveform API also delivers improved accuracy compared to SAIF-based average flows because conditional controls are incorporated automatically for switching.
The bottom line is that the Activity Plot and the Dynamic Read Waveform API enable power analysis and power exploration at the system level that is not possible with a file-based flow.