
In 2010, digital data storage requirements hit the “Zetta” prefix, with only one prefix, the “Yotta,” left available
Source: EETimes

Until the 19th century — let’s say until the Napoleonic Wars — life on earth proceeded at a slow pace with no significant differences over long periods of time. If you were a farmer in ancient Egypt, your daily life would not have been much different 2,000 years later under Louis XIV, the Sun King of France, save for possibly somewhat less harsh conditions and slightly more food.
The setting abruptly changed in the 19th century, even for humble farmers. Driven by scientific discoveries and a flurry of inventions, the technological revolution introduced a radical inflexion point and gave rise to massive growth that continues today at an ever-increasing pace. Myths were shattered and questions that had remained unanswered for millennia suddenly found answers, which triggered new questions and opened doors into new fields of human knowledge.
Discoveries in the early 1800s led to new findings in the ensuing decades that, in turn, set the path to breakthroughs and inventions on an accelerated scale unseen by humankind since Homo sapiens first walked the earth.
Where better to look for proof of the exponential progress of the sciences than in the mindboggling escalation of numerical prefixes associated with physical metrics?
The metric system was one of many new ideas conceived during the French Revolution at the close of the 18th century. It was intended to rein in control and order among the many confusing and conflicting systems of weights and measures being used in Europe. Back then, units of length, land area, and weight varied not just from one country to another, but from one region to another within the same country.
The metric system replaced the traditional units with one fundamental unit for each physical quantity, now defined precisely by the International System of Units. Multiples and fractions of these fundamental units are created by adding prefixes to the names of the defined units. These prefixes denote powers of 10, so that metric units are always divided into 10s, 100s, 1,000s, etc.
As originally conceived, the range of prefixes covered six orders of magnitude (106), from one milli (1/1,000) at the low end to one kilo (1,000) at the high end. Over time, these multipliers have been extended in both directions.
About two decades ago, in 1991 to be precise, the 19th General Conference on Weights and Measures extended the list of metric prefixes to the powers of +24 and -24, as illustrated in Table 1.
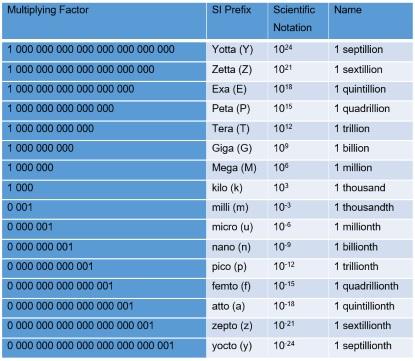
Table 1. Metric prefixes defined at the 19th General Conference on Weights and Measures in 1991
Are the latest ranges, now covering a space of 48 orders of magnitude (1048), large enough to assure that any physical measurement is going to be included?
The evolution of digital data
Let’s take a look at digital data — an area that has seen exponential growth in the past decade or so — which may be classified as either structured or unstructured.
Structured data is highly organized and made up mostly of tables with rows and columns that define their meaning. Examples are Excel spreadsheets and relational databases.
Unstructured data is everything else. Examples include the following:
- Email messages, instant messages, text messages…
- Text files, including Word documents, PDFs, and other files such as books, letters, written documents, audio and video transcripts…
- PowerPoints and SlideShare presentations
- Audio files of music, voicemails, customer service recordings…
- Video files that include movies, personal videos, YouTube uploads…
- Images of pictures, illustrations, memes…
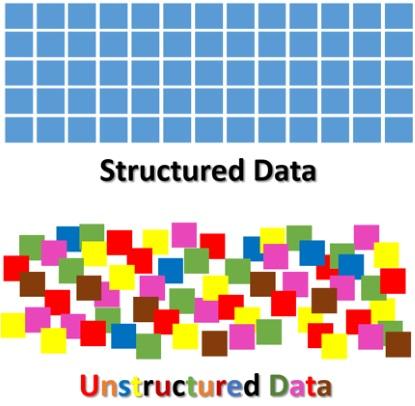
Figure 1. Graphical representations illustrate the difference between structured and unstructured data (Source: Sherpa Software)
The volume of unstructured data exploded in the past decade and half. Just compare the size of a text file such as The Divine Comedy — which was translated into English by Henry F. Cary in 1888 — at 553kB with the file size of an HD video that stores a movie like The Bourne Identity at 30GB. The difference is of seven orders of magnitude (107) or 10 million times.
Statistics published by venues that track the digital data market are staggering. According to IDC Research, digital data will grow at a compound annual growth rate (CAGR) of 42% through 2020. In the 2010-2020 decade, the world’s data will grow by 50X; i.e., from about 1ZB in 2010 to about 50ZB in 2020.
“Between the dawn of civilization and 2003, we only created five exabytes; now we’re creating that amount every two days. By 2020, that figure is predicted to sit at 53 zettabytes (53 trillion gigabytes) — an increase of 50 times.” — Hal Varian, Chief Economist at Google.
And IBM found that humans now create 2.5 quintillion bytes of data daily; that’s the equivalent of about half a billion HD movie downloads.
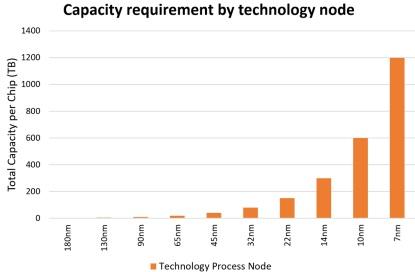
Figure 2. The growth of structured versus unstructured data over the past decade shows that unstructured data accounts for more than 90% of all data
Digital data measurement
Let’s consider an oft-overlooked anomaly with regard to measuring digital data. This anomaly is that digital data is measured using a binary system, not a decimal or metric system. The basic unit of digital data is the bit (“b”), and eight bits make up a byte (“B”). Alphanumeric characters are coded in bytes, one per character. The storage industry uses bytes, while the networking industry refers to transmission speeds useing bits-per-second.
In a metric system, 1,000 is equal to 10 to the power of 3 (103), but 1kb (kilobit) or 1kB (kilobyte) correspond to two to the power of 10 (210), which equates to 1,024 bits or 1,024 bytes, respectively. In other words, 1kB is a little larger than 1,000 bytes. This is a small difference that, oftentimes, no one cares about. However, when the amount of information reaches a trillion bytes (1TB), the difference amounts to 10%, and that’s no longer trivial. Table 2 illustrates the multiplying factor associated with using a binary system.
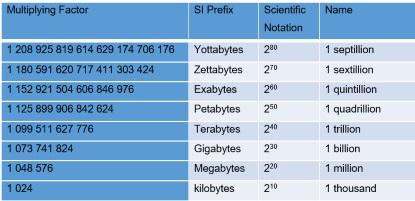
Table 2. Examples of prefixes used to measure digital data with a binary system
Attempts to solve this conundrum have been made by several organizations who have suggested the use of a different set of prefixes for the binary system, such as kibi for 1,024, mebi for 1,048,576, gibi for 1,073,741,824, and so forth. To date, none of these are in general use.
Consumers continue to ignore the difference, while disk drive and computer manufacturers targeting consumers only mention it in passing in the “small print.” Enterprise storage companies, on the other hand, now live in the terabyte/petabyte era and do distinguish between the two — at least when calculating and comparing costs.
Digital data storage supply and demand
The advent of the computer accelerated our ability to create data, but it also brought a new challenge. Now that we can generate data blazingly fast, how do we store it?
My Compaq 386 desktop from around 1989 had a hard disk drive (HDD) with a capacity of about 100MB. In 2001, about 10 years later, the data storage capacity of my laptop HDD amounted to about 2GB — roughly an increase of one order of magnitude or 10X. My 2016 laptop boasts a solid state hard drive (SSHD) with 1TB of capacity. That’s in the ballpark of one thousand times increase in less than 15 years.
It’s far easier to generate zettabytes of data than to manufacture zettabytes of data storage capacity. A wide gap is emerging between data generation and hard drive and flash production. In Figure 3, the blue bar chart maps data growth — actual and estimated — over a 20-year period. The orange bar chart tracks storage factory capacity.
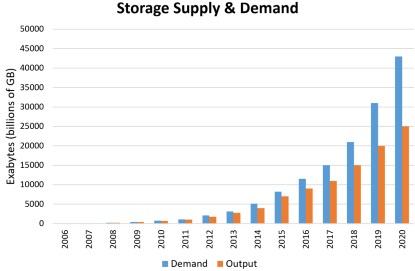
Figure 3. This chart shows storage supply and demand growth over two decades
By 2020, demand for capacity will outstrip production by six zettabytes, or nearly double the demand of 2013 alone.
Electronic design data in EDA
An interesting application area that produces large quantities of data is the Electronic Design Automation (EDA) industry. At the present rate, the data generated by EDA tools doubles every year, but not all EDA data is equally organized.
The process of designing an electronic chip is based on creating an accurate model of the chip’s architecture, behavior, and functionality. Broadly speaking, the process consists of two stages or phases: front-end and back-end.
During the front-end design phase, engineers create a chip design by compiling source files into a model. The chip design model is verified by scheduling and running simulation jobs in a large compute grid.
The front-end phase generates an input/output (I/O)-intensive workload when a large number of jobs run in parallel: EDA applications read and compile millions of small source files to build and simulate a chip design. The workload requires high levels of concurrency because of the large number of jobs that need to run in parallel, generating a random I/O pattern.
During the back-end design and verification phase, the data access pattern becomes more sequential. The backend workload tends to have a smaller number of jobs with a sequential I/O pattern that runs for a longer period of time. The output of all the jobs involved in a chip’s design phases can produce terabytes of data. Even though the output is often considered working space, the data still requires the highest tier of storage for performance.
Within the storage system, EDA workflows tend to store a large number of files in a single directory — typically per design phase — in a deep directory structure on a large storage system. Performance-sensitive project directories, including those for both scratch and non-scratch directories, dominate the file system.
Directories contain source code trees, front-end register transfer level (RTL) files that define logic in a Hardware Description Language (HDL), binary compiled files after synthesis against foundry libraries, and the output of functional verifications and other simulations (see also Performance at Scale for EDA). This poses interesting challenges to the vendors of the data storage devices that EDA vendors rely upon, as we will discuss in a future column.
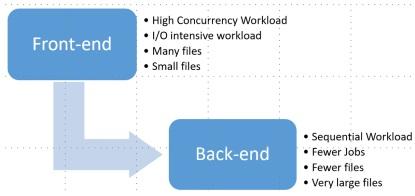
Figure 4. Design data generated at the front-end has different structures than does data generated by back-end EDA tools
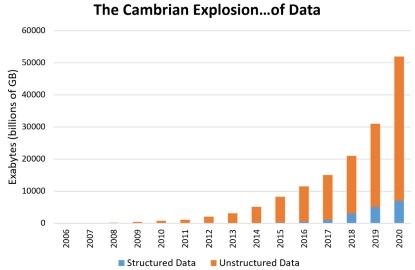
Figure 5. Estimated storage capacity requirements by EDA tools for the entire RTL-to-GDSII flow per chip design versus technology process node
Conclusion
At the time of the 19th General Conference on Weights and Measures in 1991, a metric prefix to the power of 24 was considered to be large enough to include virtually all known physical measures for many years to come.
Approximately twenty years later, in 2010, digital data storage hit the “Zetta” prefix, with only one prefix, the “Yotta,” left available. Maybe the time is approaching for another conference to further expand the available prefixes.
Dr. Lauro Rizzatti is a verification consultant and industry expert on hardware emulation (www.rizzatti.com). Previously, Dr. Rizzatti held positions in management, product marketing, technical marketing, and engineering. He can be reached at lauro@rizzatti.com.