Source: Verification Horizons
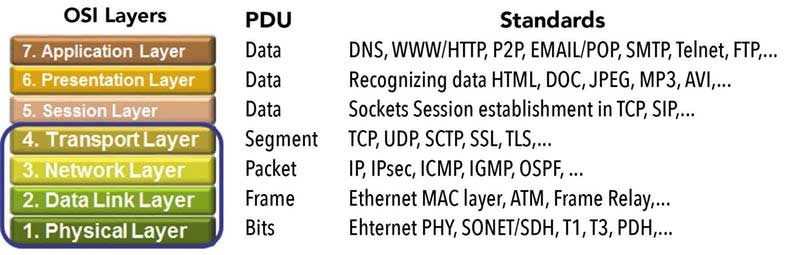
Take a step down the stack beyond optical networks, switches, routers and software-defined networking to consider the networking system on chip (SoC), the brains of the network infrastructure.
Networking SoCs, integrated circuits (ICs) that combine all components of an electronic system, such as an Ethernet switch or router, onto a single chip, are more complex these days than any one human could imagine. In fact, they have replaced the graphics chips found in mobile phones, personal computers, workstations and game consoles as the largest and most complex chip designs. Project teams report that they consume 500,000 or more application- specific integrated circuit (ASIC)-equivalent gates.
The reasons for the massive size and extreme complexity are the large number of Ethernet ports, soon crossing over the 1,000 ceiling; expanded throughput, up to 400Gbps; sub-microsecond latency; and improved redundancy and resiliency to minimize performance degradation due to network congestion, failures and resource exhaustion during maximum utilization.
For project teams on a tight budget and even tighter time- to-market schedule, verifying that the chip will work as specified is no small feat. Missing a bug could mean a costly silicon respin, something no one wants because the risk is too great. And missing the time-to-market window may possibly wipe out the entire potential revenue.
To alleviate the risk, project teams are turning to a 30-year old hardware design verification tool known as hardware emulation that’s been transformed into the foundation of a networking chip verification plan. It performs at five to six orders of magnitude faster than the traditional hardware description language (HDL) simulator, and is undefeated by design sizes and complexities. It supports Ethernet traffic in and out of the design-under-test (DUT) at a rate of several millions of packets per minute per port in a 1k Ethernet switch. Contrast this to a simulation bandwidth of 1,000 packets per day.
But speed and bandwidth, the most important characteristics of emulation, are not the only features that attract verification engineers. Without powerful debugging capabilities, an emulation platform would be like a Ferrari without a steering wheel: a fast bullet driving straight into a wall. And, it’s not just hardware debugging here. A best- in-class hardware emulator is the only verification tool able to track a bug across the embedded software and the underlying hardware, an important consideration when embedded software consumes much of the chip’s inner workings.
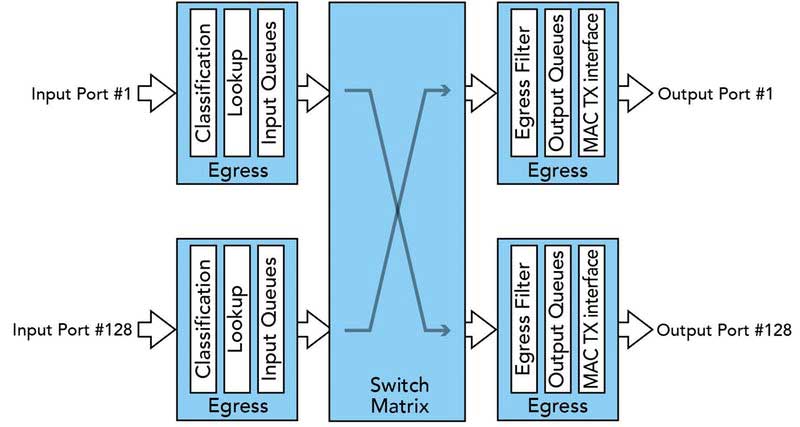
Let’s explore how an Ethernet switch SoC design with a 128-port interface and a variable bandwidth of 1/10/40/100/120Gbps can be debugged using hardware emulation. The high-level block diagram in figure 1 on the following page depicts a typical Ethernet switch.
Each input port connects to a functional block called “Ingress,” and each output port to a functional block called “Egress.” Ingress and Egress are pipelines that include most of the media access control (MAC), internet protocol (IP) and Transport Table Ternary Content Addressable Memories (TCAMs), and other address resolution logic, as well as lookup engines for the access control list (ACL). Each Ingress can be connected internally to any Egress via a switch table consisting of a huge memory with logic fabric, queueing, direct memory access (DMA), linked list control, store and forward and cut-through logic.
The size of this monstrous SoC reaches into the 700-million ASIC-equivalent gates. This level of complexity rules out the use of an HDL simulator, but it is not an obstacle for a modern hardware emulator.
Traditionally, an emulator would be deployed in in-circuit- emulation (ICE) mode that possesses the unique capability to test the DUT via real-world traffic, or Ethernet traffic in this instance. Since the real world Ethernet traffic flows at gigahertz speed, and an emulation platform reaches at most few single digit megahertz, a direct connection between the two is not sustainable. Instead, a speed- rate adapter –– conceptually a FIFO –– must be inserted between them to accommodate the tester’s fast speed to the relatively low speed of the emulator.
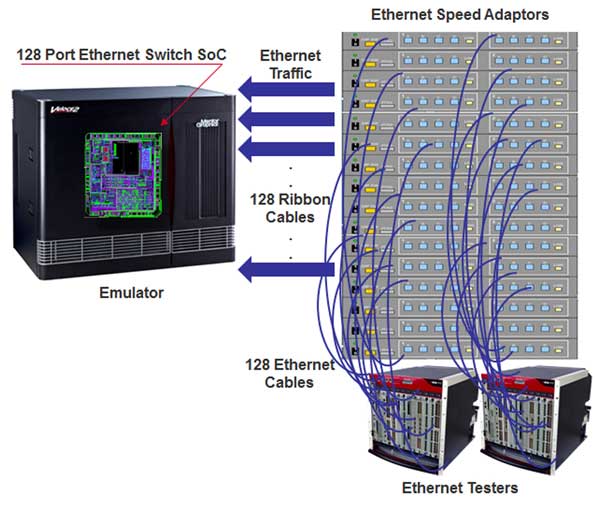
This adds complication to the setup. In fact, the testing setup to verify a 128-port Ethernet switch in ICE mode would be a headache to support. Just consider that the user would need to connect one Ethernet tester to one Ethernet speed-rate adapter, and the adapter to one of the 128 ports. In total, he or she would need 128 Ethernet testers and 128 speed adapters, making the testing environment massive, messy, complex, unreliable and costly.
If that wouldn’t be enough, only one user in the proximity of the emulator would be able to access it. Remote access from the four corners of the world, 24/7, would be painful since it would require manned supervision to swap out the Ethernet tester setup and swap in whatever ICE setup the next user would need. This “out/in swapping” would continue 24/7 all the time. See figure 2 below.
In the past decade, a new deployment mode that removes most of the drawbacks of ICE has been devised and broadly adopted by the emulation user community. Called transaction-based emulation –– different vendors use proprietary names, such as Mentor Graphics’ Transaction- Based-Acceleration or TBX–– it replaces the physical test environment with a functionally equivalent software-based model written at a high-level of abstraction, via C/C++/ SystemC or SystemVerilog language, and running on the host computer. This virtual testbench communicates with the DUT via a transaction-based interface that is protocol dependent. See figure 3 below.
For all the good that TBX or TBA has to offer, it still requires the creation of a testbench, a time-consuming and error prone-task. The semiconductor industry is not sitting idle, however. Enter VirtuaLAB, a new concept of a virtual environment that encompasses a testbench targeting specific applications, such as USB, PCIe and Ethernet.
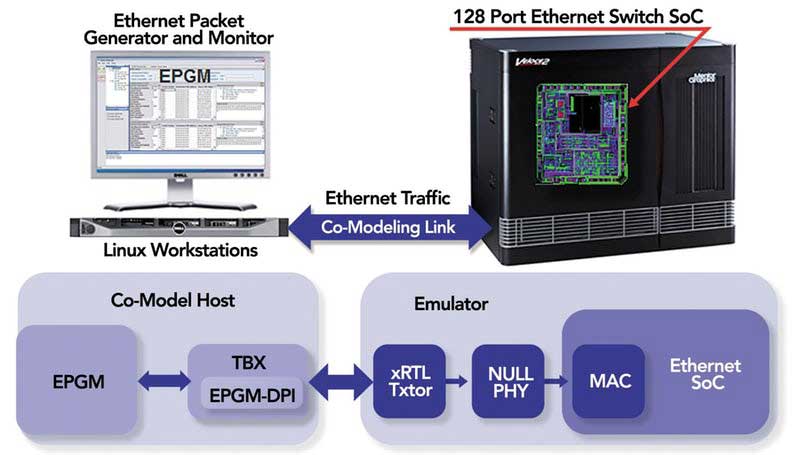
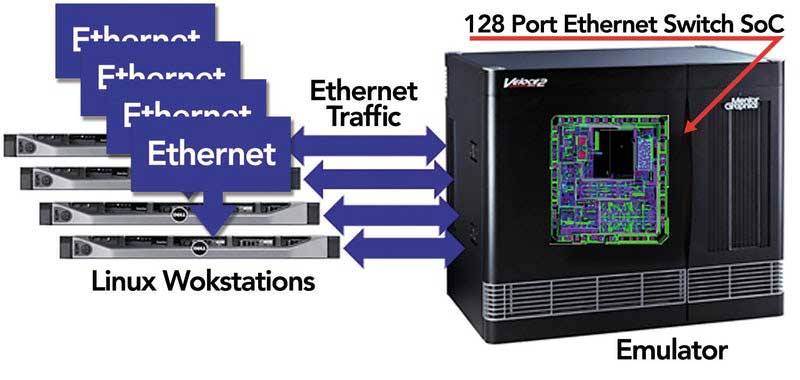
For example, an Ethernet VirtuaLAB provides a software- controlled environment for generating, transmitting and analyzing Ethernet packets to test Ethernet SoC designs mapped inside an emulation system. See figure 4 below.
Figure 4: The setup to verify a 128-port, 1/10/40/100/120-Gb/s Ethernet switch using VirtuaLAB would look like this.
Finally, the last roadblock on the migration path from ICE to Virtual has been eliminated. In an Ethernet VirtuaLAB, Ethernet testers are modeled in software running under Linux on a workstation connected to the emulator. The model is an accurate representation of the actual physical tester, based on proven implementation intellectual property (IP).
This virtual tester includes an Ethernet Packet Generator and Monitor (EPGM) that generates, transmits and monitors Ethernet packets with the DUT. It has the ability to configure GMII, XGMII, XLGMII, CGMII, CXGMII, CCMII and CDMII interfaces for 1G, 10G, 25G, 40G, 50G, 100G, 120G, 200G and 400G respectively.
The interface between the VirtuaLAB and the DUT includes one instance of VirtuaLAB-DPI communicating to a Virtual Ethernet xRTL (extended register transfer level) transactor hooked up to a Null-PHY, connected to the DUT. One xRTL transactor is required for each port of any xMII-supported type. See figure 6 on the following page.