
In the rapidly evolving domain of AI processors, performance benchmarking has become essential for distinguishing meaningful innovation from hype.
The semiconductor industry is in the midst of rethinking time-honored verification strategies, a result of increasingly layered software stacks in today’s system-on-chip (SoC) designs. The answer is often real-world, application software workloads, frequently from standardized benchmarks tailored to specific markets that mimic end-user behavior.
Interactive vs. offline benchmarks: uncovering the truth in AI performance
In the rapidly evolving domain of AI processors, performance benchmarking has become essential for distinguishing meaningful innovation from hype.
The offline benchmark fallacy
Offline benchmarks, though widely used, are typically conducted under isolated conditions. These tests often measure throughput in a static, standalone environment, ignoring the interference inherent in real-world deployment scenarios, such as latency dependencies, system contention, and multi-user concurrency. They lead to overly optimistic performance metrics that rarely translate into actual user experience.
A common pitfall of offline benchmarking is the flawed assumption that throughput scales linearly with batch size. While this may hold in a static test environment, it obscures the fact that different AI processor architectures behave differently under load. Two systems might report similar throughput at a specific batch size, yet diverge dramatically in how they handle latency, especially when serving many users simultaneously. As a result, offline benchmarks can produce skewed comparisons that fail to reflect the realities of production workloads.
Why online or interactive benchmarking matters
To better reflect real-world usage, benchmarking methodologies must evaluate interactive inference performance, measuring throughput alongside end-to-end (E2E) latency per user. This dual-focus approach helps assess how a system behaves under realistic conditions when multiple users simultaneously submit queries/requests and receive AI responses.
By progressively increasing the number of concurrent users, interactive benchmarks expose how system performance scales, revealing the critical tradeoff between overall system throughput and individual response time. This dynamic benchmarking method provides a much more actionable and meaningful view of system capabilities that directly correlates with user experience.
Latency: more than meets the eye
In AI inference, latency measures the delay between a user’s query submission and the delivery of the final response token. In a single-user environment, this can be measured with relative simplicity, as the system handles only one stream of computation at a time. However, in real-world deployments where many thousands of users interact with a shared infrastructure simultaneously, latency measurement becomes significantly more complex.
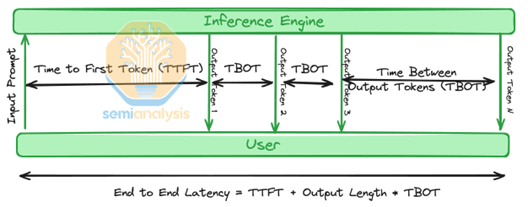
Common latency-related metrics such as time-to-first token (TTFT), measuring the delay until the first output token is generated, and time-between-output tokens (TBOT), measuring the pace of token emission once generation has begun, offer limited insights in multi-user settings. They fail to capture queuing delays, resource contention, and backend inefficiencies that emerge at scale processing.
The more meaningful metric is end-to-end (E2E) latency, which encompasses the entire response timeline from query submission, through prompt processing, system queuing, and token generation, to the final output delivery. This metric is tightly aligned with real user experience—especially in latency-sensitive applications such as chatbots, search, and virtual assistants. See Figure 1.
Visualizing the tradeoff: throughput vs. latency
A thorough evaluation of inference performance should plot throughput (queries/sec) against E2E latency (msec) as the number of concurrent users grows.
Typically, the chart can be divided into three concurrency zones: low, optimal, and overloaded.
- In the low concurrency zone (green), as the number of concurrent queries grows, latency remains low, but throughput potential is not fully utilized.
- In the optimal concurrency zone (yellow), maximum throughput is gradually achieved while maintaining acceptable latency.
- In the overloaded zone (red), latency grows rapidly, while throughput flattens out or may even decline.
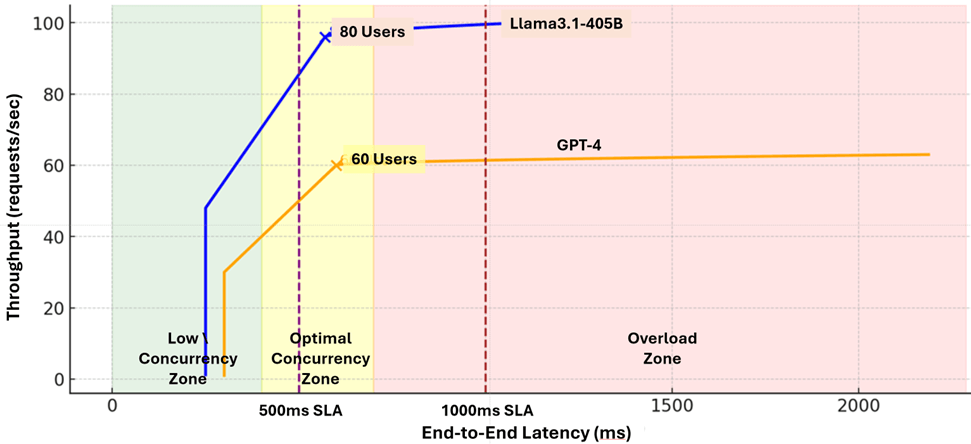
The former sustains higher throughput under increasing concurrent load and enters the overloaded zone later. The latter shows earlier latency degradation and slower throughput scaling due to heavier system overhead and stricter latency constraints.
In the AI processing landscape, MLPerf reigns supreme
MLPerf has emerged as the industry-standard benchmark to measure the performance of AI processors across diverse hardware architectures.
Launched in 2018 by MLCommons, MLPerf was initially focused on foundational ML tasks, but over time, it has steadily expanded its scope to cover ten key benchmark suites: MLPerf Training; MLPerf Training: HPC; MLPerf Inference: data centers; MLPerf Inference: edge; MLPerf Inference: mobile; MLPerf Inference: Tiny; MLPerf Storage; MLPerf Client; AILuminate; ALGOPERF. With each new release, MLPerf has introduced additional models, tasks, and performance metrics to keep pace with the rapidly evolving AI landscape.
As of 2025, the MLPerf Inference suite has reached version 5.1, and the MLPerf Training suite version 5.0—underscoring MLCommons’ commitment to keeping pace with advances in machine learning, including large language models, generative AI, and transformer-based architectures.
MLPerf fulfills two key roles in the AI ecosystem: evaluation and optimization. It provides a standardized benchmark for comparing ML processors across diverse tasks—from image classification and object detection to speech recognition and natural language processing—enabling fair, repeatable performance comparisons across hardware and software environments. At the same time, it helps engineers identify bottlenecks, fine-tune compilers, optimize runtime libraries, and co-design hardware-software stacks for specific workloads.
The MLPerf Inference suite reflects the diversity of real-world deployments through several categories: Data Center (offline, server, and interactive scenarios), Edge (offline, single-stream, and multi-stream), Mobile, and Tiny, the latter two targeting constrained devices. Each scenario models a distinct use case—offline emphasizes throughput for large batches; single-stream tests real-time latency for single inputs such as voice assistants; multi-stream simulates user-facing applications with concurrent queries; server emulates asynchronous multi-user requests; and edge focuses on inference under power and compute constraints.
New this year
A new interactive scenario has been introduced for LLMs such as Llama. This benchmark pushes systems to operate under stricter latency targets with smaller batch sizes, making the results far more representative of real-world user experiences where responsiveness is critical.
Key caveat: MLPerf’s primary modes (Offline and SingleStream) do not account for full deployment environments. Only the server scenario approximates online behavior, but still in a semi-simulated, bounded way, lacking real-world user concurrency and latency-pressure dynamics. For full realism, a custom online benchmarking framework is needed—one that evaluates E2E latency under concurrent user load, which MLPerf5.1 does not comprehensively address.
Beyond MLPerf: the rise of online benchmarks
While MLPerf has evolved as the industry standard for AI processor performance in standalone mode, an early entrant in this space is SemiAnalysis.
SemiAnalysis
SemiAnalysis is an independent research firm and subscriber-based newsletter founded by Dylan Patel and supported by a global team of analysts and engineers. Its domain expertise covers the entire semiconductor and AI infrastructure landscape, from chip design and wafer fabrication to datacenter architecture and cloud economics.
The firm’s mission is to bridge the gap between deep technical knowledge and the business realities of deploying AI systems. By offering detailed, model-based analyses of accelerators, datacenter buildouts, total cost of ownership (TCO) forecasts, and production trends, SemiAnalysis provides a foundation for strategic decision-making in an industry driven by constant innovation.
What distinguishes SemiAnalysis is its commitment to rigorous, data-driven evaluation. Its proprietary tools, including ClusterMAX and cloud TCO models, are based on granular, bottom-up datasets. This depth of analysis has earned it the trust of major players in the industry, including Nvidia, AMD, Oracle, and CoreWeave, which rely on the insights for benchmarking and infrastructure planning.
Beyond the data, SemiAnalysis also emphasizes accessibility. The content is designed to be valuable to both technical experts and business stakeholders, ensuring that insights are not only accurate but also actionable across different roles. In doing so, they help engineers, investors, and operators alike navigate the complex, high-stakes world of AI hardware with greater clarity and confidence.
An example excerpted from SemiAnalysis website is captured in the graph in Figure 3. It maps throughput per GPU versus E2E latency of five accelerators (AMD MI300X and MI325X; Nvidia H100, H200, and H200-TRT) processing Llama 405B workload.
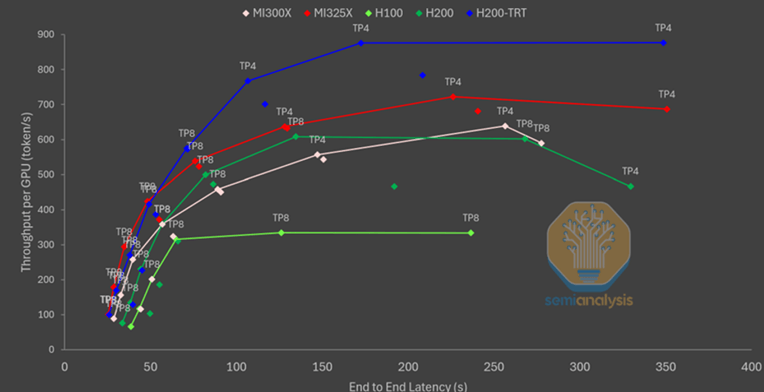
To quote the website, “The graph shows that serving large dense models is AMD GPUs’ strong suit. Specifically, the MI325X seems to crush the competition across all latency scenarios, and the MI300X even outperforms the H200 with vLLM at around the 250-second latency mark. On the other hand, the H100 plateaus at around 350 tokens per second, and the H200 with vLLM at 600 tokens per second. The H200 with TensorRT-LLM reigns supreme, significantly outperforming all the other configurations after the 50-second latency mark.”
Running large dense models for summarization-like workloads is still memory-bound, despite the workload being prefill-heavy, and we can see the effects from the graph.
As AI continues to expand into every sector, the tools we use to measure system performance must keep pace. SemiAnalysis is leading this shift with complementary benchmarking approaches that go beyond the narrow focus of traditional tests.